10 Model, Inquiry, Data Strategy, and Answer Strategy
This chapter is part of a book in active development and has not yet been through the author’s review. Content may change as the review advances.

The research decision. The four parts of your own design, written down before any data exist: a model of the world, the one named quantity you want out of it, a plan for how the data arrive, and a plan for turning that data into your quantity. Then the harder call: whether those four parts actually point at the same thing.
10.1 Why this decision matters
The decision on the table: the four parts of your design, and whether all four point at the same quantity.
Picture an analytics lead reading your one-page design before you spend months on it. Her worry is simple: “Show me the exact number you are after, then show me that the way you collect and crunch the data can actually reach that number. If those two drift apart, every result you bring me answers a question I never asked.” A design that skips this step is not rigorous. It is a hope with good formatting. Getting the four parts to agree, on paper, before you inspect any outcome-bearing field or compute the answer, is the cheapest quality check you will ever run.
10.2 The concept
Any research design can be described in four parts. Blair, Cooper, Coppock, and Humphreys named that framework MIDA, one letter each (Blair et al. 2019), and Blair, Coppock, and Humphreys developed it at book length in Research Design in the Social Sciences (Blair et al. 2023). This book adopts their four labels and puts them in plain language for a first quantitative project.
- Model: your written picture of how the world could work, meaning which things exist and what could affect what. Example: “a listener’s chance of accepting a recommended song runs from 0 to 1, and a new recommender could nudge it up.”
- Inquiry: the one exact quantity you want from that world, named before any outcome arrive. Example: “the average lift in accept rate the new recommender causes across listeners.”
- Data strategy: every procedure that makes your data exist, meaning who gets sampled, who gets which condition when you assign one, and how each outcome is measured. Example: “randomly send each session to the old or new recommender, then log every accept.”
- Answer strategy: the whole procedure that turns those data into an answer, meaning how you prepare them, the estimate you compute, how you state the uncertainty around it, and how you read what comes back. Example: “accept rate in the new group minus accept rate in the old group, reported with an interval.”
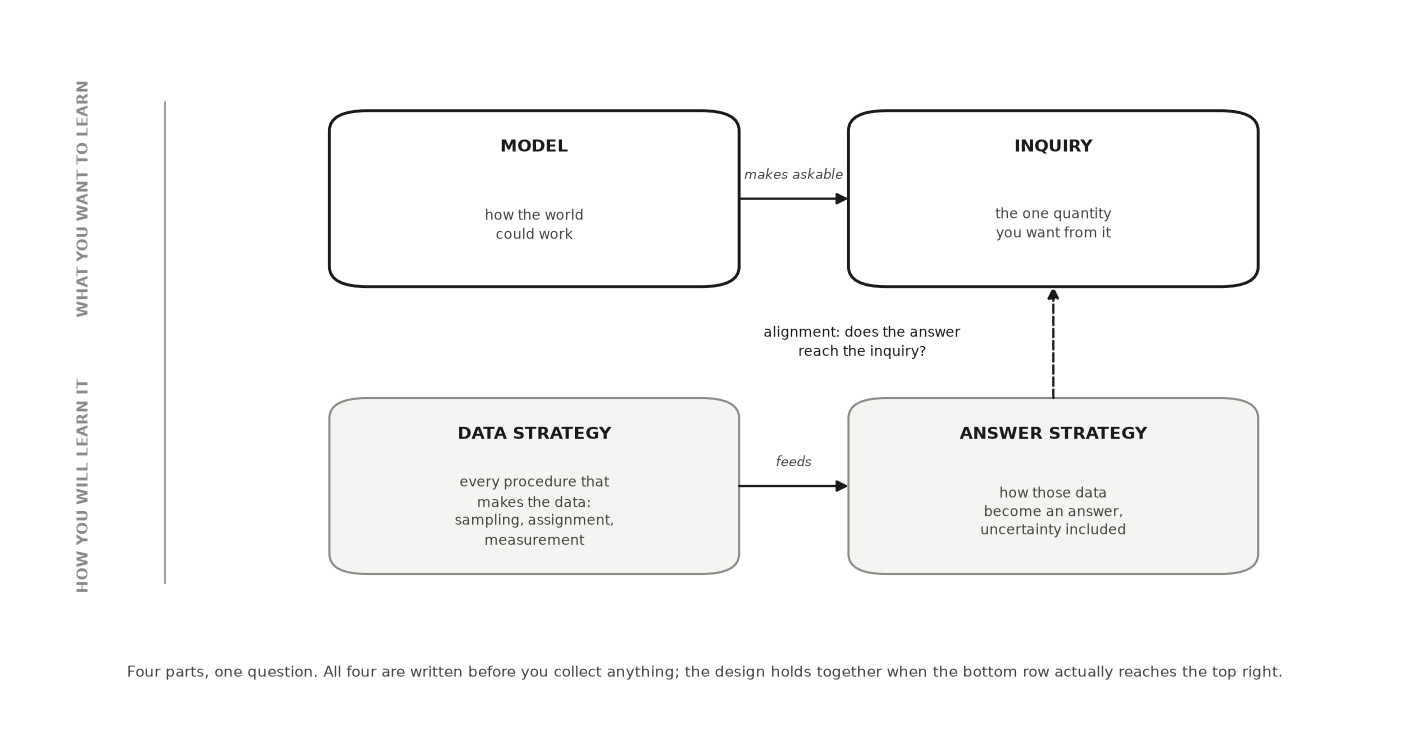
The four are not a checklist you fill in any order (Blair et al. 2023). They must align, meaning your data and answer strategies actually reach the inquiry your model makes askable. Example of misalignment: a causal inquiry (“the lift the recommender causes”) served by a data strategy where the people who see the new version differ systematically from those who do not. What that comparison delivers is an association, meaning two things move together without proof that one caused the other.
Read that carefully, because it is easy to draw the wrong lesson. Alignment does not mean your data get to rewrite your question. The inquiry is still causal; this design simply does not reach it. Nor does the absence of randomizing settle the matter: observational designs can carry causal answers when they bring a defended identification argument suited to the design, which is the whole subject of a later chapter. The honest diagnosis names the gap: causal inquiry, currently unidentified under this data and answer strategy (Hernán and Robins 2020). Naming that on paper is the whole job here.
10.3 A worked example
Take a music-streaming company testing whether a new autoplay recommender raises how often listeners keep the suggested track. Walk the four parts.
The model says each listener has two possible accept rates, one under the old recommender and one under the new, and the new one could be higher, lower, or the same. The inquiry is the average difference between those two rates across all listeners, one number, causal in kind. The data strategy buckets each incoming session at random into old or new, so nothing about the listener decides which version they get. The answer strategy computes the accept rate in each bucket and subtracts.
Now audit alignment. The inquiry asks for a caused difference. Random bucketing is what licenses that word, because it breaks any link between who the listener is and which version they see. So the four parts agree. Contrast a tempting shortcut: ship the new recommender to new users and compare them against existing users on the old one. That data strategy no longer aligns with a causal inquiry, because new and existing users differ in ways that also move accept rate. The inquiry stays exactly what it was: the caused lift. What changes is the claim this evidence supports, which drops from “causes” to “is associated with,” leaving the inquiry itself causal and currently unidentified. Same question, broken alignment.
Declaring a design as these four linked parts, so that misalignment becomes visible before data collection, is the approach set out in the design-declaration literature (Blair et al. 2023).
The block below runs both data strategies against the same model and the same inquiry. Watch the second number miss a truth the first one finds.
import numpy as np, pandas as pd
SEED = 464
rng = np.random.default_rng(SEED)

n = 4000
# MODEL: each listener has two accept rates; the new recommender adds 4 points.
heavy = rng.random(n) < 0.45              # heavy listeners accept more anyway
accept_old = 0.30 + 0.18 * heavy
accept_new = accept_old + 0.04

# DATA STRATEGY 1 — random bucketing: nothing about the listener decides arm.
new_arm = rng.random(n) < 0.5
kept = np.where(new_arm, rng.random(n) < accept_new, rng.random(n) < accept_old)
randomized = kept[new_arm].mean() - kept[~new_arm].mean()

# DATA STRATEGY 2 — the shortcut: ship "new" to new users, who differ.
is_new_user = ~heavy                       # new users are the lighter listeners
kept2 = np.where(is_new_user, rng.random(n) < accept_new, rng.random(n) < accept_old)
shortcut = kept2[is_new_user].mean() - kept2[~is_new_user].mean()

print(f"true caused lift             : {0.04:+.3f}")
print(f"randomized buckets           : {randomized:+.3f}")
print(f"new-vs-existing users        : {shortcut:+.3f}")
print("\nsame inquiry both times. the second design does not answer it —")
print("the inquiry stays causal and is now unidentified")
10.4 An AI failure case
You paste your streaming question and ask for MIDA. The tool returns four confident, well-formatted parts and calls the design “rigorous.” Read closely: it wrote the data strategy as “compare new users on the new recommender to existing users on the old one,” and it kept the inquiry worded as a caused lift. That is two failures at once. The data strategy is plausible-but-wrong, because user tenure moves accept rate on its own. And the draft presents that comparison as if it answers the caused-lift inquiry, a silent scope change from what the evidence supports (an association) to what the write-up claims (a cause). The inquiry may keep its causal wording; what it may not do is borrow this comparison as its answer. You catch it two ways: set the inquiry’s words beside the data strategy and ask whether randomization actually happened, then sketch the model as a diagram and look for an arrow from “user tenure” into both the version seen and the accept rate. That open arrow is the confounder the fluent draft never mentioned.
10.5 It is your turn
You are working inside Studio 4: Declare and diagnose provisionally. Keep what you write here; the studio’s milestone chapter is where it joins the other lessons’ pieces into one artifact you can defend.
You have a question and a gap you can defend. This step turns them into a design, on one page, in four parts that have to agree with each other. Those four parts are the MIDA framework of Blair, Cooper, Coppock, and Humphreys, developed at book length in RDSS; you are writing your own project into their labels.
The hands-on half of this section lives in the chapter’s companion notebook: open it in Colab with the badge at the top, and work the steps there.
Write your own draft of each part first, then ask. Committing first gives the AI output something to disagree with. And expect to go around more than once: draft, read the reply, correct the one part it got wrong, paste your correction back, ask again. Each turn should sharpen the inquiry into fewer words, not more.
Three choices stay yours. Which world your question assumes (the model, and so what could confound it). Which single quantity you want (the inquiry, named in your words, not the AI’s paraphrase). Whether your four parts align, and therefore whether your claim boundary is causes, only is associated with, or causal but not yet identified by this design. That third state is a real answer, and keeping your question while admitting the design cannot reach it is more honest than shrinking the question to fit the data. An AI can draft candidate parts. Deciding they agree, and owning the claim that follows, is research judgment you cannot hand off.
Write your model in three or four sentences of plain language. Which units exist, what could affect what, and what is allowed to vary. No equations required. Then draw it as boxes and arrows, even badly.
Write your inquiry as one sentence naming one quantity: an average, a difference, a rate, a share. If you need the word “and” to state it, you have two inquiries. Pick the one you would defend first.
Write your data strategy: who or what gets sampled, from which list, and who gets which condition, if any. Say honestly whether anything is randomized, or whether the world assigned conditions for you.
Write your answer strategy: the arithmetic that turns your data into your inquiry. A subtraction of two averages counts. Simple is a feature here.
When you are ready to delegate this step:
Act as a research-design tutor. Here is my research question: [paste it].
Draft the four MIDA parts as a labeled list — Model, Inquiry, Data strategy,
Answer strategy. State the Inquiry as one exact quantity. Mark each part
"confident" or "guessing." Do not smooth over gaps.
After running, verify: read the drafted Inquiry’s words next to your question’s words. Do the kind and reach match? This counters silent scope change, where the tool answers an easier, adjacent question than the one you asked.
Audit the alignment yourself and write the one sentence that matters: “Because my data strategy is , the strongest honest wording of my result is .” If that sentence lands on is associated with rather than causes, you have not failed; you have found your claim boundary early, which is the point.
When you are ready to delegate this step:
Act as a hostile methodologist. Here are my four MIDA parts: [paste them].
Name the single worst misalignment — a place where my data or answer strategy
cannot reach my stated inquiry. Give one concrete way my design fails, not
praise.
After running, verify: check the objection against your own alignment note. This counters sycophantic agreement, where the tool calls a design sound because you proposed it.
Log the draft in your AI Research Ledger, then verify the alignment claim with a named method from the Verification Guide; peer reasoning or a causal diagram both fit. An AI reviewer may argue the misalignment with you; the decision to accept or reject the objection stays yours.
When you are ready to delegate this step:
Find one real, published study that used a design like mine to answer a similar
question. Give title, authors, year, and venue. If you are not confident it
exists, say so instead of inventing one.
After running, verify: open a library database and locate the exact study before citing it. This counters confident fabrication, where the tool returns a plausible citation for a paper that does not exist.