MGMT 17300: Data Mining Lab
Exploratory Data Analysis with R (I): Summarization
August 01, 2024
Overview
Lesson 07 Exercise Review
Lesson Question!
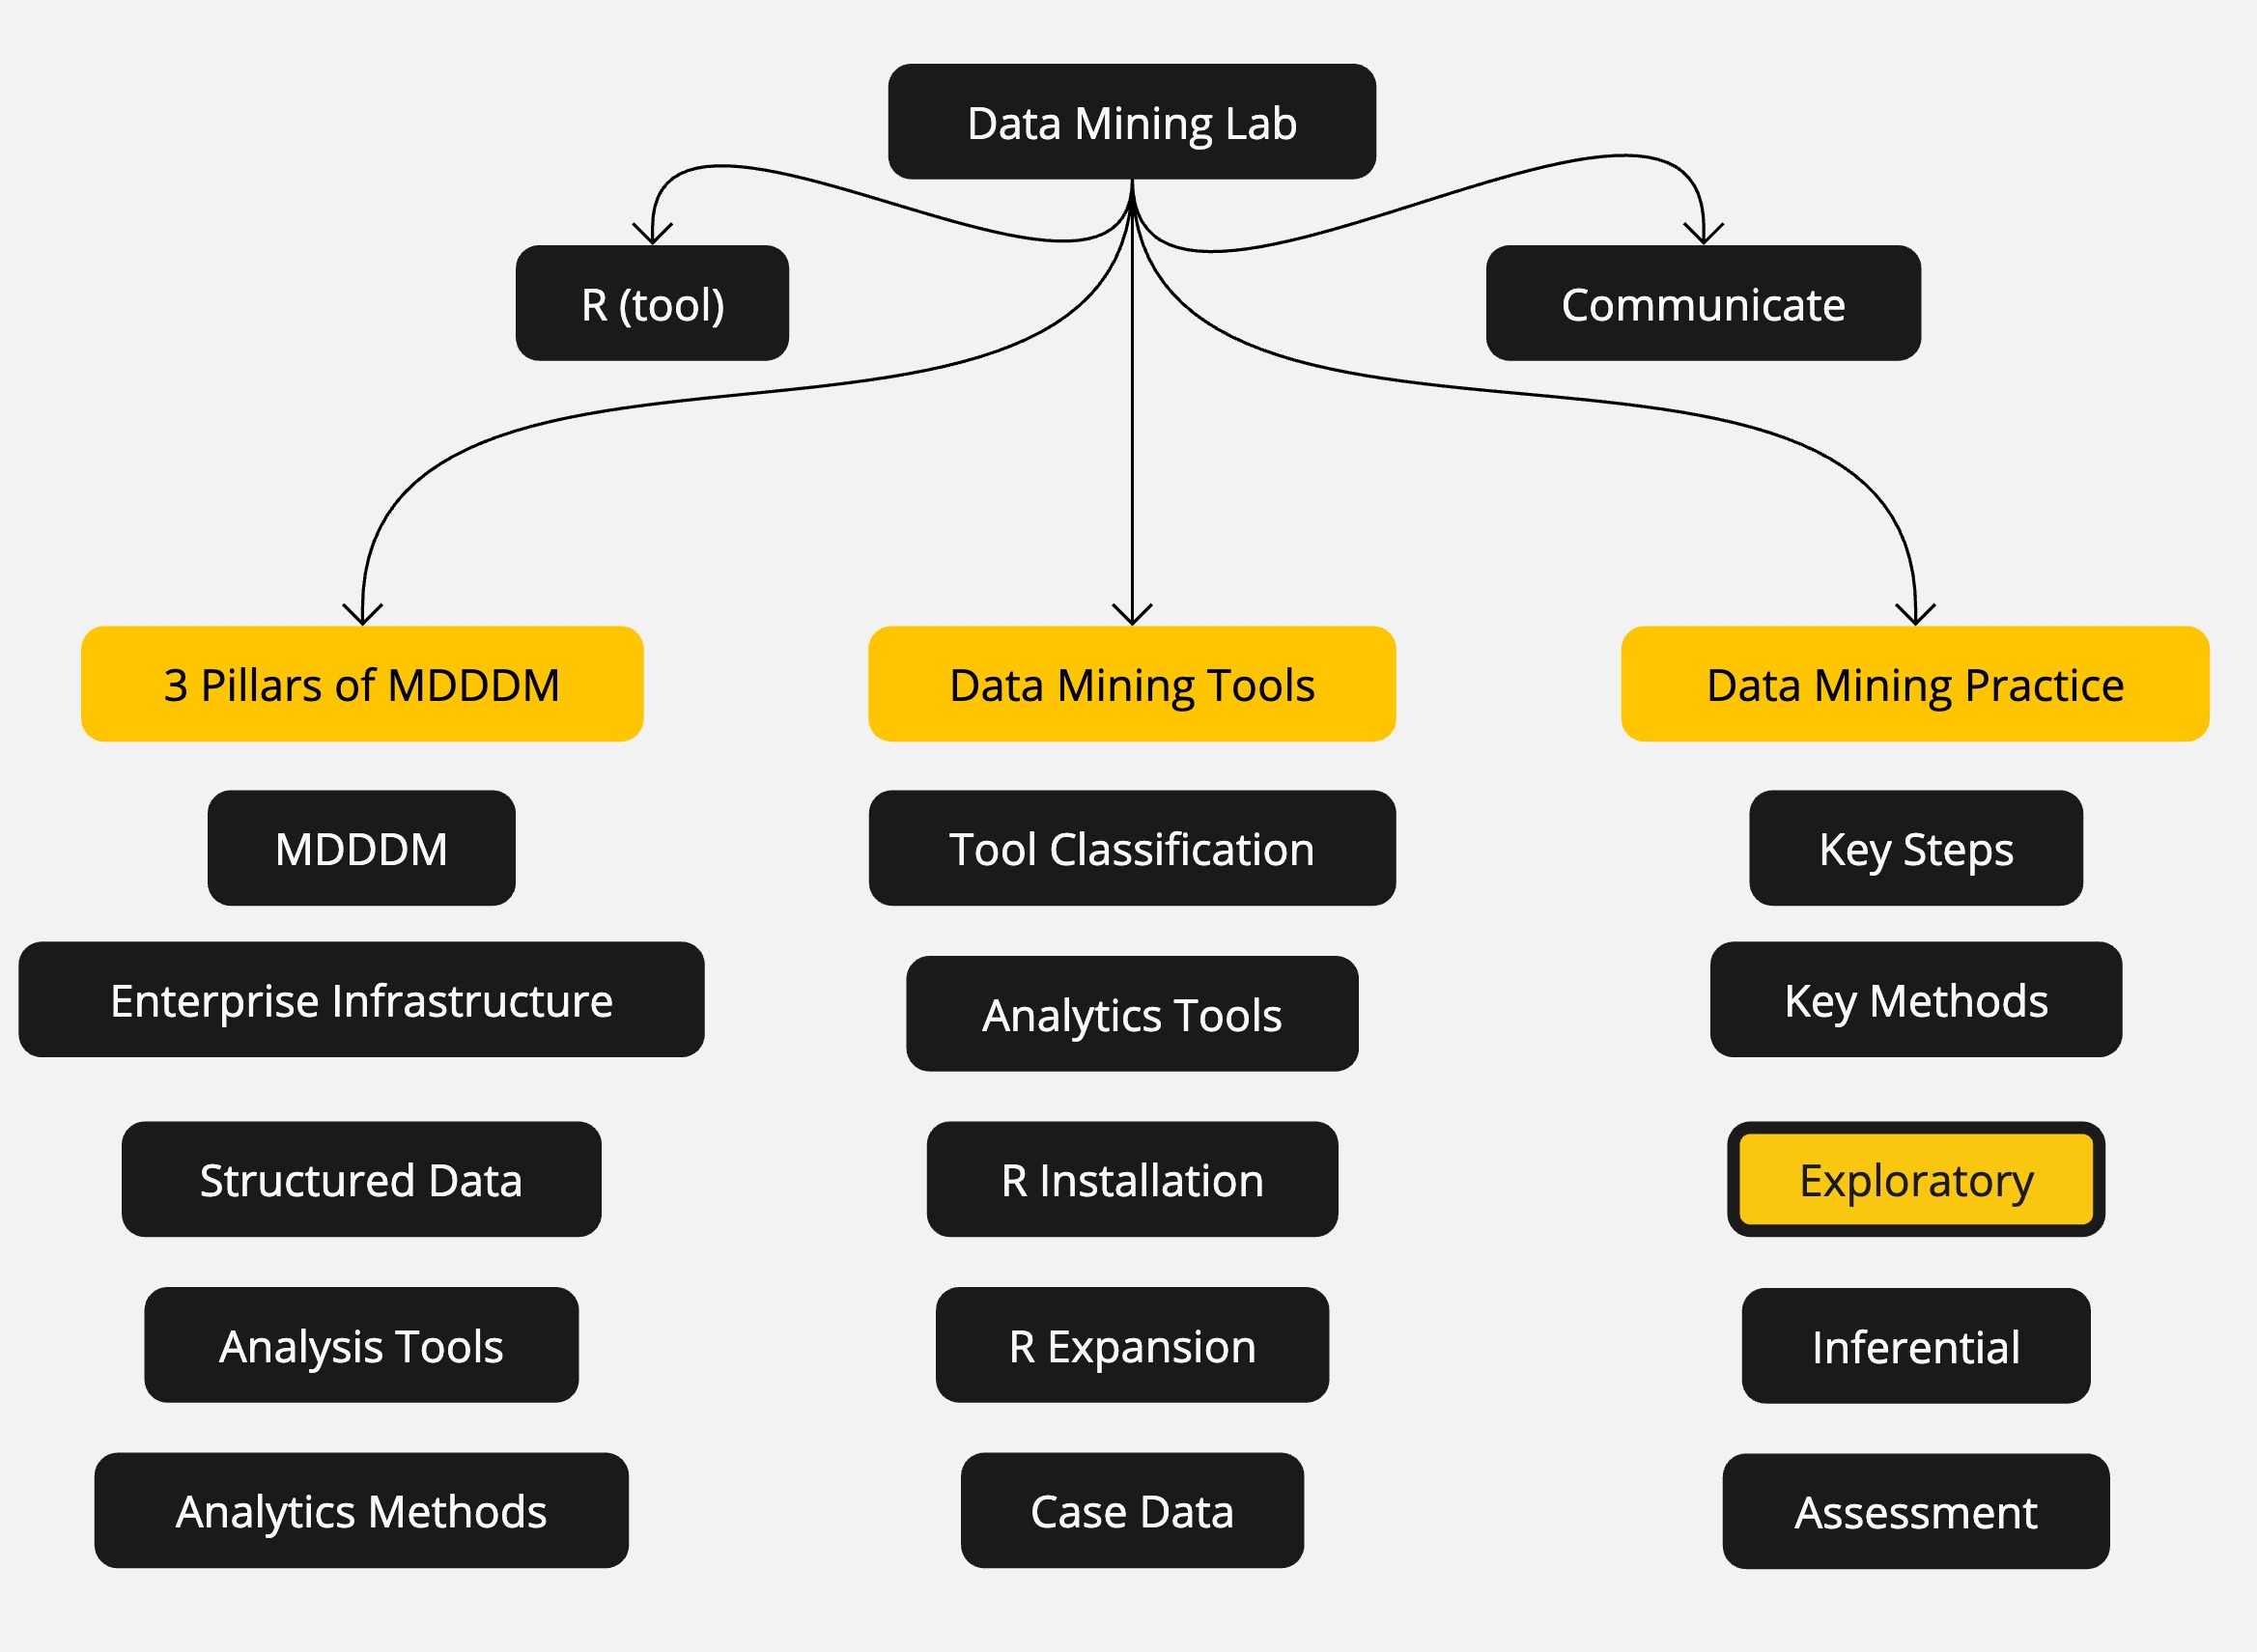
Course Learning Milestones
The 8 Key Steps of a Data Mining Project
Data Mining
Exploratory Data Analysis (EDA)
Obtaining Summary Statistics with R
Lesson 07 Exercises Review
Lesson Question!
Course Learning Milestones
Course Learning Milestones

The 8 Key Steps of a Data Mining Project
The 8 Key Steps of a Data Mining Project
Goal Setting
- Define the project’s goal
Data Understanding
- Acquire analysis tools
- Prepare data
- Data summarization
- Data visualization
Insights
- Data mining modeling
- Model validation
- Interpretation and implementation
Data Mining
Data Mining
Exploratory Data Analysis (EDA): EDA is the Data Mining initial step. It involves the examination and analysis of datasets to gain an understanding of the actual and potential aspects of the data using summarization and visualization techniques.
Inferential Data Analysis: In contrast, this step refines available data, identifying valuable information such as potential patterns, relationships, trends, and assessing their reliability.
Exploratory Data Analysis (EDA)
Exploratory Data Analysis (EDA)
EDA aids analysts in comprehending the available data and serves as a means to detect potential data issues, such as missing values, outliers, or inconsistencies.
EDA primarily comprises two main categories:
Data Summarization: Involves obtaining summary statistics.
Data Visualization: Entails presenting raw data or summary statistics through plots.
Obtaining Summary Statistics with R
Obtaining Summary Statistics with R
Summary statistics, often referred to as descriptive statistics, encompass various measures, including those of:
Central tendency (e.g., mean, median, mode)
Measures of dispersion (e.g., variance, standard deviation, range)
Measures of shape (e.g., skewness, kurtosis)
These summary statistics provide specific insights into data distribution and characteristics. They are indispensable in data analysis across domains like statistics, data science, social sciences, finance, and business.
Purposes of Descriptive Statistics in Data Mining
Descriptive statistics serve multiple purposes, including:
- Summarizing data: This involves calculating summary statistics for variables, such as mean, median, standard deviation, and frequency distribution.
In R, you can use functions like:
to summarize data.
- Exploring relationships: This involves exploring relationships between two or more variables to identify correlations or associations.
Understanding Summary Statistics for Different Data Types
Different data types may require distinct descriptive statistics.
Numeric variables have statistics like mean, median, variance, etc.
Categorical data have meaningful statistics like count and proportion.
When applying the R function summary() to variable(s), it automatically generates descriptive statistics tailored to the data type. For character data, which is not meant for calculation, no descriptive statistics are generated.
Exploring the mtcars Dataset in R
Exploring the mtcars Dataset in R
To explore the mtcars dataset, you can:
Open the
CarDataMiningscript created in previous lessons.Add and run the following code.
Comparing Summary Statistics for Numeric and Categorical Variables
You can compare summary statistics that R generates for numeric and categorical variables:
Since the variable am is numerical and am1 is defined as categorical, summary() produces different statistics for them.
Calculating Specific Summary Statistics in R
- To calculate the average horse power of all cars:
Summary
Summary
Main Takeaways from this lecture:
Exploratory Data Analysis (EDA) is a crucial first step in the data mining process.
- It involves understanding and summarizing the main characteristics of a dataset.
Two primary categories of EDA:
Data Summarization: Involves generating descriptive statistics.
Summarizing data: Providing a concise overview of variables. Summary statistics include measures of central tendency, dispersion, and shape.
Exploring relationships: Identifying correlations and associations between variables.
Data Visualization: Helps in visualizing data patterns and insights.
R functions like
summary(),mean(),median(),table(),cor(), andcov()are used to explore data and identify key statistics.
Thank you!
Data Mining Lab